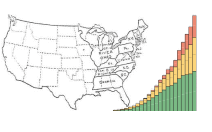
The first two graphics in this chapter present data on children ever born. The question was first asked on the decennial census in 1890 and again in 1900 and 1910; however, the data were not tabulated for presentation in census reports for those years. The question was introduced again in the 1940 census, and 1910 and 1940 census data on children ever born were tabulated and published in 1940 census reports. The question was then asked from 1950 through 1990, but was dropped for the 2000 census. Starting in 1970, the question was asked of all women rather than being limited to ever-married women; however, since the data presented here are for women who have completed (or nearly completed) the childbearing years, the effect of this change on historical trends in childbearing is negligible. Information collected on children ever born was supposed to have been limited to live births (i.e., excluding stillbirths); however, information collected in the 1910 census may have inadvertently included some stillbirths, resulting in an overstatement of children ever born. (This possibility is suggested by a comparison of childbearing data for the 1865-1869 birth cohort of women at ages 40-44 in 1910 and at ages 70-74 in 1940 in Figure 8-1.) While there may be some underreporting of fertility by elderly women (such as of children who died in infancy), census data for subsequent censuses do not indicate that this is a significant factor. For simplicity, birth cohorts of women are shown in calendar years. For example, women ages 45-49 in 1940 are shown as the 1890-1894 birth cohort rather than as the 4/1/1890-3/31/1895 birth cohort, which would be more precise given the 4/1/1940 data for the 1940 census.
The third graphic in this chapter presents data on the child-woman ratio. In the absence of census data on children ever born through much the 19th century, the child-women ratio, defined here as the ratio of the population under age 5 to the female population 20-44, provides a surrogate measure of childbearing. Calculation of the ratio requires only data on the population by age and sex; however, the accuracy of the ratio depends on the relative accuracy of census data for the two groups, suggesting that the calculated ratio may be low if the number of children under age 5 is not reported as completely as the number of females ages 20-44. In addition, the child-woman ratio can be affected by the age composition of women in the 20-44 age span since age-specific birth rates vary by age (e.g., typically higher for women ages 20-34 than for women ages 35-44).
Figures
