Information on race has been collected in every decennial census beginning in 1790, although the categories were limited to White and Black through the 1850 census, with free Blacks and slaves being classified through 1860. The racial categories included on the census questionnaires have changed over time reflecting changes in social attitudes and political considerations; however, in general, these categories have reflected social usage and not an attempt to define race biologically or genetically. The population of Hispanic origin (of any race), which is referred to here also as the Hispanic population, was first identified comprehensively in the 1970 census. Previously, data on other topics, such as country of birth, country of birth of parents, and mother tongue, were used to identify portions of the Hispanic population. Historical estimates of the Hispanic population back to 1850 have been developed by Gratton and Gutmann (see citation below) using sample data in the Integrated Public Use Microdata Series (IPUMS) data base. (See Minnesota Population Center, no date, “IPUMS-USA, Frequently Asked Questions (FAQ)“) Information on race was obtained primarily by enumerator observation through 1950, by a combination of direct interview and self-identification in 1960 and 1970, and by self-identification since 1980. With enumerator observation, a person of mixed White and other race was usually classified with the other race. Historically, the large majority of Hispanics were classified by race as White; however, starting in 1980, a substantial proportion of Hispanics reported as “other” (the questionnaire wording has varied: Other in 1980, Other race in 1990, or Some other race in 2000). The limitations to comparability between 1990 and 2000 data on race are substantial because in 2000, respondents could, for the first time, report more than one race.
The history of census data on race and Hispanic origin is extremely complex with many issues of comparability, and the user of these data is strongly encouraged to consult more detailed sources. In addition to Data Sources, see, Claudette Bennett (2000), “Racial Categories Used in the Decennial Census, 1790 to Present,” Government Information Quarterly, Vol. 17, No. 2, pp. 161-180; in Historical Statistics of the United States: Millennial Edition (2006), Charles Hirschman et al, “Race and Ethnicity: Definitions and Measurement,” Vol. 1, pp. 1-4 to 1-9, and Brian Gratton and Myron P. Guttman, “Hispanic Population,” Vol. 1, pp. 1-177 to 1-179; Campbell Gibson and Kay Jung (2002), “Historical Census Statistics on Population Totals by Race, 1790 to 1990, and by Hispanic Origin, 1970 to 1990, for the United States, Regions Divisions, and States,” U. S. Census Bureau, Population Division Working Paper No. 56; and U.S. Office of Management and Budget (1997), “Revisions to the Standards for the Classification of Federal Data on Race and Ethnicity,” Federal Register, Vol. 62, No. 210 (October 30), pp. 58782-58790.
Figures
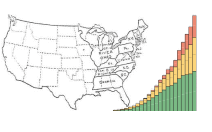
4-1. Population by Race for the United States: 1790 to 2010
4-3. Percent Distribution of the Population by Race for the United States: 1790 to 2010
4-5. Population by Race and Hispanic Origin for the United States: 1990 to 2010
